
Gain valuable insights into the Australian property market of 2023 with our newly released report.
Based on data collected from Lendi, Aussie and Domain Home Loans, this report provides a realistic snapshot of the challenges faced by households due to economic pressure.
We dive into the facts and figures in this article.
How did the cash rate change in 2023?
After an intense cycle of rate tightening in 2022, Australian homeowners faced ongoing mortgage pressure in 2023.
On top of the 3% cash rate increase that occurred throughout 2022, RBA cash rate movements caused the official cash rate to increase an extra 1.25% as of November 2023.
In total, there was an increase of 4.25% over 2022 and 2023.
These rate adjustments contributed to the overall financial strain experienced by homeowners.
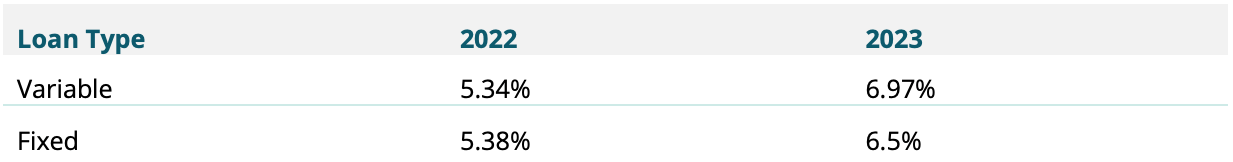
How did the cash rate hiking cycle impact interest rates in 2023?
As a result of the cash rate increases, the median variable mortgage rate available to owner occupiers rose by 1.63% throughout the year.
This increase further escalated the financial burden faced by homeowners, making it more challenging to manage their mortgage repayments.
Home loan type taken out over 2023
More and more borrowers opted for variable rate loans as interest rates continued to rise. In 2023, 90% of all borrowers chose a variable rate for their mortgage, which is an increase of 3% compared to 2022.
How did home loan repayments change after the cash rate hikes in 2023?
After a 1.63% interest rate rise, homeowners with a $500,000 P&I, variable, 30-year house loan will have to pay $528 more each month than they did in 2022.
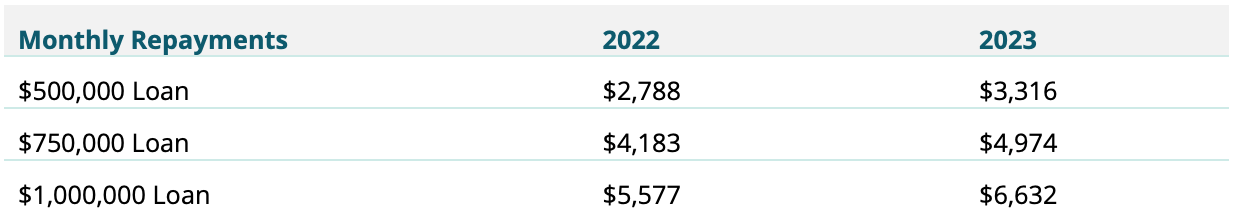
Average monthly repayments in 2022 vs. 2023
What loan activity was most popular in 2023?
The type of activity in the loan market was significantly impacted by the rising interest rate environment, with refinancing outpacing new loans.
Although refinancing volumes decreased by 6% in favour of new loans in 2023, this trend continued and fewer borrowers chose fixed rate loans as interest rates rose.
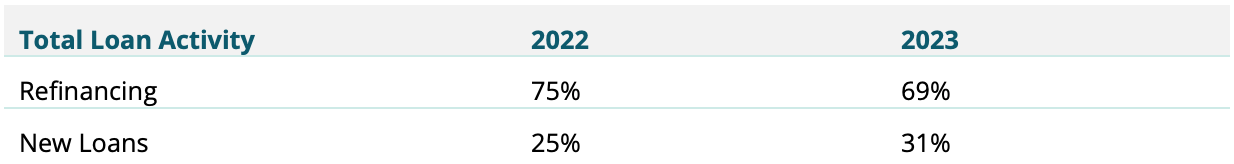
Total loan activity in 2022 vs. 2023
What percentage of borrowers had a fixed rate home loan in each state?
Over the year to November 2023, the majority of customers on a fixed rate home loan were located in Queensland, followed by New South Wales and Victoria.
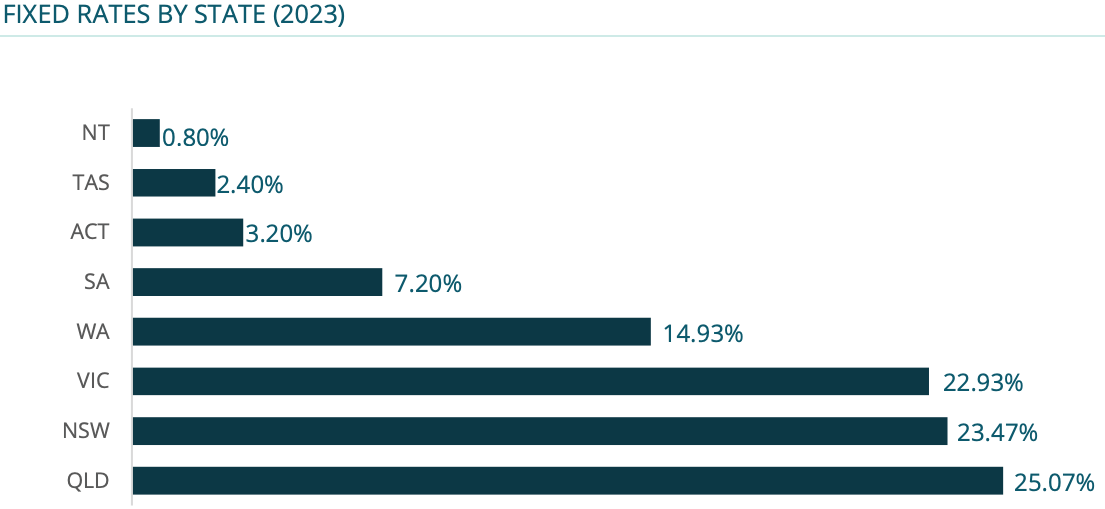
Fixed rate home loans by state
How many borrowers took out an interest-only home loan?
There were 1% less interest only home loans taken out by homeowners in 2023 compared to 2022, despite the rising expenses of payments associated with increasing interest rates.

Interest only loans taken out in 2022 vs. 2023
How many borrowers invested in property?
The number of mortgage investment applications decreased by 4% in 2023, with investors accounting for only 24% of all home loan applications.
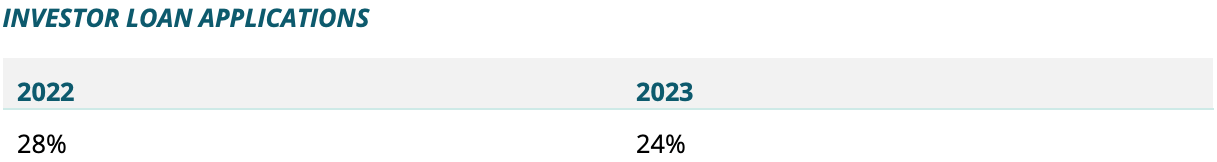
Investor loan applications in 2022 vs. 2023
You might also be interested in: Your guide to investing in property
What were the home buyer demographics in 2023?
The year 2023 saw a decline in the median income of borrowers, with the average dropping from $97,000 to $95,000.
When examining the individual profiles of borrowers, it is worth noting that single borrowers, who make up 2 out of every 10 loans, earned a higher income than the average Australian wage. Their median yearly income was $109,000.
Furthermore, household incomes also experienced a setback in 2023, decreasing by 3%.
For couples, the individual income was $91,000, or a combined income of $182,000. It is worth noting that this is lower compared to the previous year, where the combined income stood at $189,000.
These observations shed light on the financial picture of borrowers in 2023, with a downward trend in median incomes and the impact on household finances.
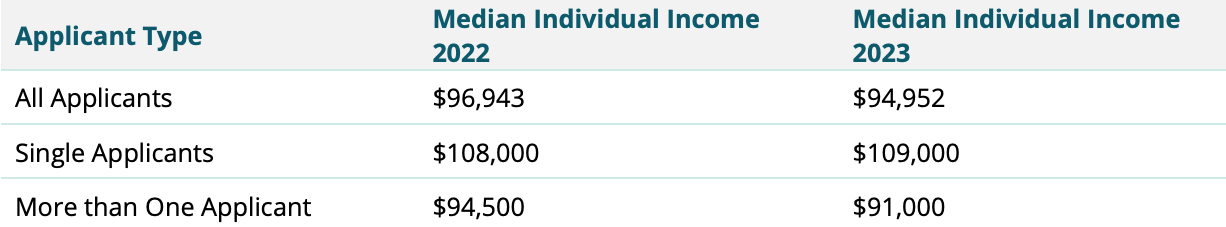
Median individual income of applicant type
Younger people still faced difficulties in becoming homeowners. On average, single home loan applicants were 41 years old, and couples were 40 years old.
You might also be interested in: Bridging loans 101: your guide to buying and selling property
How much did properties cost in each state?
In 2023, property prices in Australia saw the median value decrease by 2%.
All states experienced a decline in values, except Tasmania and Western Australia, where median prices increased by 20% and 14% respectively.
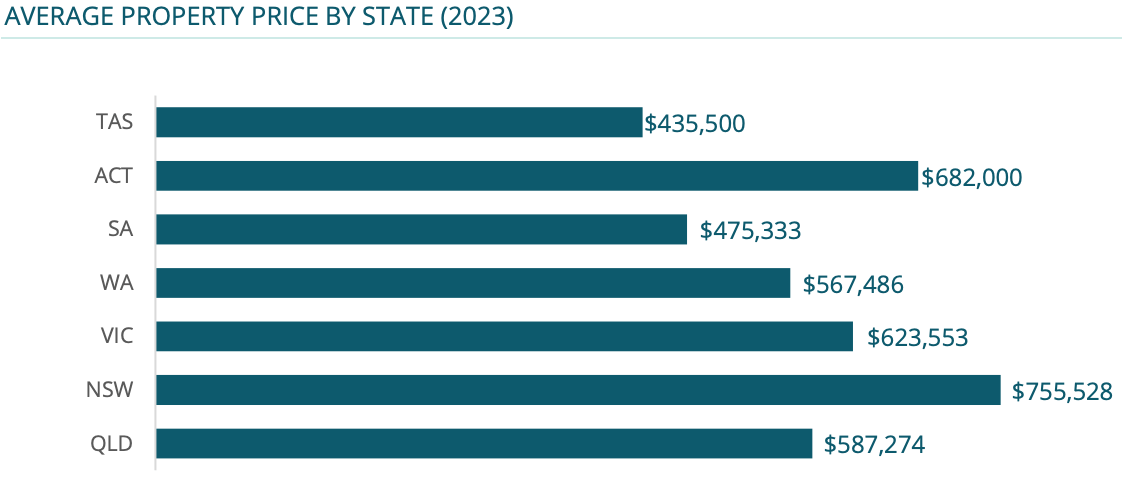
Average property price by state in 2023
Among the states, Queensland saw the largest decrease in property values, with a significant drop of 12% by November 2023.
The ACT and Victoria also experienced declines, with property values decreasing by 9% and 8% respectively.
How many people bought a home in 2023 compared to 2022?
With a combination of rising interest rates, higher inflation and falling wages, the number of first home buyers able to make their way into the property market decreased significantly in 2023.
Over the course of the year, the proportion of first home buyer loans fell to 35% – a decrease of 12% compared to the previous year.

First home buyer activity in 2022 vs. 2023
What were the demographics of first home buyers?
First time home buyer information shows that despite the challenges caused by the increasing cost of living, there was a glimmer of hope for aspiring buyers.
The median age of the group decreased slightly from 32 years old to 30 years old in 2023.
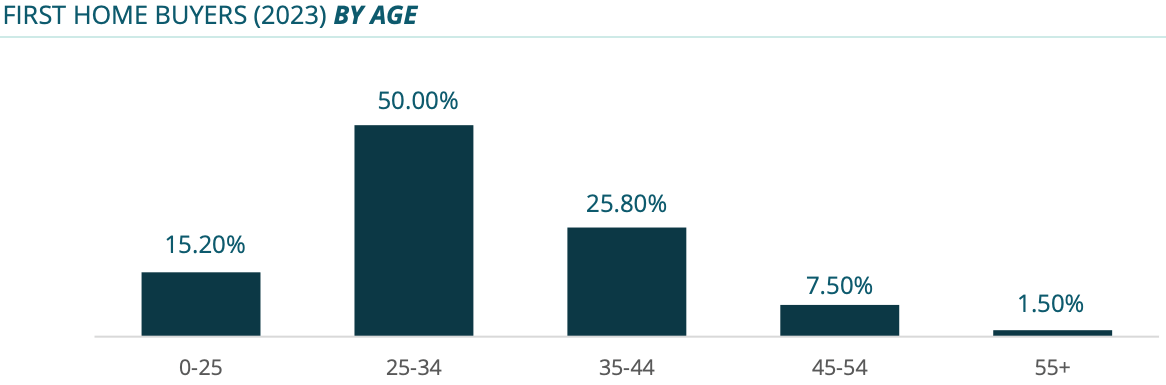
First home buyers in 2023 by age
A significant portion of first home buyers (around 50%) fell within the age range of 25 to 34.
Following closely behind were first home buyers in the 35 to 44 age category, comprising 26% of the total market.
Interestingly, first home buyers under the age of 25 made up only 15% of the market in 2023.
Owning a first home on a single income remained a substantial challenge, as single buyers accounted for just 28% of all applicants in 2023.
When it came to relationship status, the majority of first home buyers were either married (35%) or in a de facto relationship (35%).
You might also be interested in: First home buyer guide: government grants and concessions
How much were first home buyers earning in 2023?
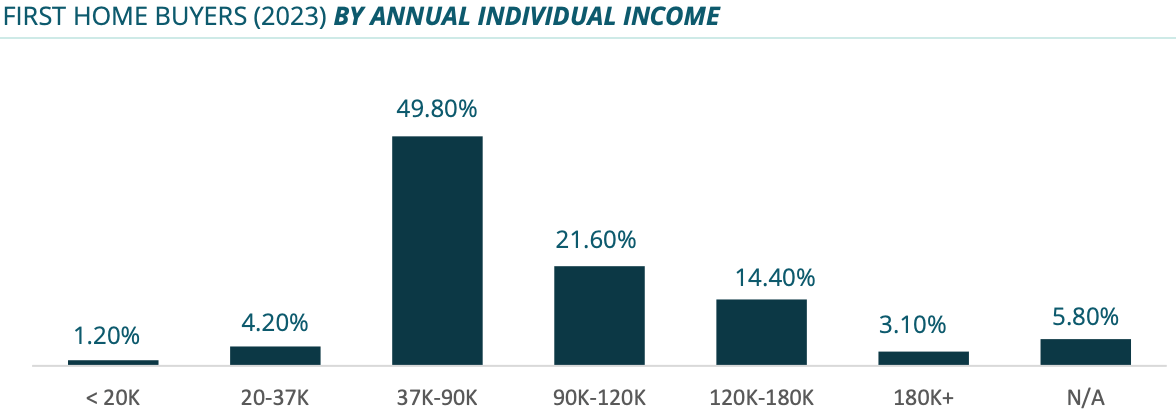
First home buyers by annual individual income
Half of all first home buyers had an individual income ranging from $37,000 to $90,000 annually
22% of them had an annual income of $90,000 to $120,000.
It is interesting to note that the median individual income for a first home buyer remained unchanged at $88,643 in 2023.
How much were first home buyers borrowing from the banks?
The average loan size for first home buyers decreased by 3%, falling from $510,000 in 2022 to $495,000 in 2023.
Where were first home buyers located in 2023?
Despite New South Wales having the highest median property values in the country, the highest proportion of first home buyer activity was centred in this state. 35% of all first home buyers in Australia were located in NSW.
Following NSW was Victoria, making up 25% of first home buyer activity.
On the other hand, the Northern Territory had the smallest percentage of first home buyers, with only 0.46% of people buying their first homes in the area.
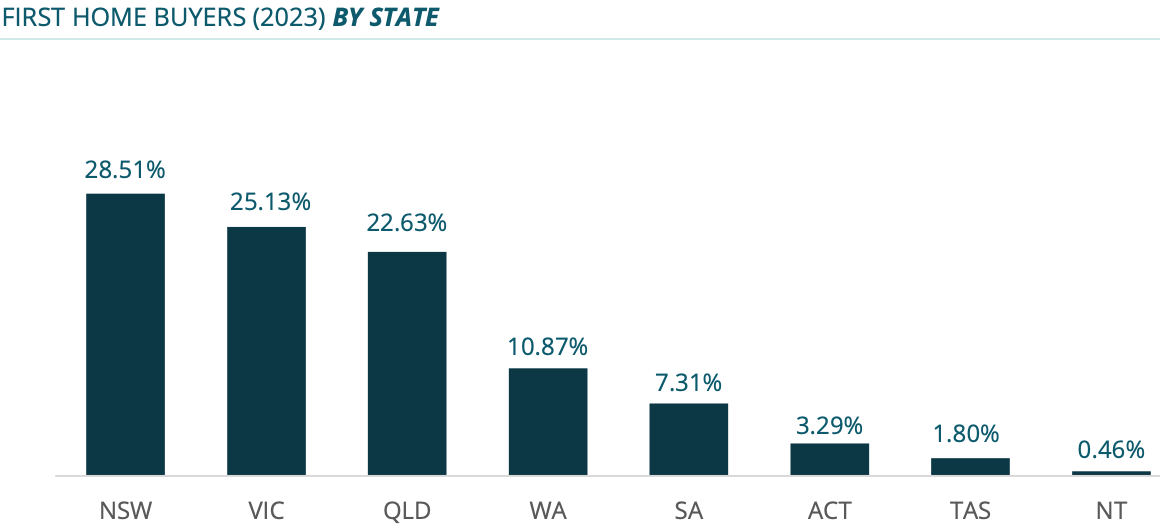
First home buyers by state in 2023
What were the top suburbs for home purchases?
The top suburbs for home purchases in 2023 were:
3030, Point Cook, VIC
4209, Coomera, QLD
3064, Craigieburn, VIC
2765, Marsden Park, NSW
2560, Campbelltown, NSW
3029, Hoppers Crossing, VIC
6164, Beeliar, WA
4207, Logan, QLD
4300, Springfield, QLD
3977, Cranbourne, VIC
Interested in buying your first home in Australia? Thinking about refinancing? Your knowledgeable local Aussie Broker can help you take the next step, whatever your home loan goal.
*2023 data is representative of loans and applications made across Lendi, Aussie and Domain Home Loans from January 2023 to end of November 2023
*2022 data is representative of loans and applications made across Lendi, Aussie and Domain Home Loans from January 2022 to December 2022